1.0 Purpose
The purpose of the simulation is to demonstrate the behaviour of the GTGs, STGs and PREGs for any load change in the integrated operation of Refinery and Fertilizer plants.
2.0 System Modelling in ETAP
- The electrical system is modelled with all Turbine Generator (TG) units interconnected to the 66kV bus at Refinery plant and 33kV bus at Fertilizer plant respectively.
- The Refinery and Fertilizer plants are interconnected through 66kV tie lines.
- The loads of the Refinery and Fertilizer plant are modelled as lumped loads at 66kV and 33kV buses respectively.
- Governor and Excitation system model for the TGs are considered as per inbuilt model available in ETAP.
- The inertia constant for the TG sets is based on inertia values furnished in the Datasheet.
3.0 Case Studies
- Base demand of the integrated system is considered as :
-
- Refinery : 296 MW
- Fertilizer : 87 MW
- The initial power flow in the tie line is zero, with demand at each plant being met by its own Generation.
- Simulation is carried out for 15 MW Load Addition at Fertilizer plant.
- Two case studies are considered :
-
- Case 1: 15 MW Load Switch ON at Fertilizer Plant (Governor Droop setting – Setting 1).
- GTG Droop setting is 4 %.
- STG Droop setting is 5 % (Refinery & Fertilizer plant).
- PREG Droop setting is 5%.
- Case 1: 15 MW Load Switch ON at Fertilizer Plant (Governor Droop setting – Setting 1).
-
- Case 2: 15 MW Load Switch ON at Fertilizer Plant (Governor Droop setting – Setting 2).
- GTG Droop setting is 6 %.
- Refinery side STG Droop setting is 7 %.
- PREG functioning in Constant Power mode.
- Fertilizer side STG Droop setting is 3 %.
- Case 2: 15 MW Load Switch ON at Fertilizer Plant (Governor Droop setting – Setting 2).
4.0 Results
- The simulation results indicating the load sharing between various TG units are summarised in Tables 1 & 2 .
- The plots of power and rpm of various TGs and Tie line MW are furnished in the Annexure 1.
5.0 Observations
- It is observed that all TG units are taking up the load change in accordance with their set droop characteristics.
- It is observed that modifying the Droop setting characteristic as per Case 2, increases the participation of Fertilizer plant STGs and reduces the participation of the TGs in the Refinery plant. The PREG is in Constant Power mode and hence does not participate in load sharing.
- The system stabilises by primary control action of the Governor and AVR of the TGs. The frequency stabilises to 49.9 HZ (99.8 %).
- The new tie line flow is 12 MW in Case 1 and 9 MW in Case 2.
6.0 Conclusions
- Primary control action by the Governor and AVR of the TG units stabilises the system after the disturbance. The frequency settles to a new value and the load sharing is as determined by the droop characteristics.
- The system will respond in a similar manner for other disturbances also. Transient stability analysis report which is part of the Power System Study scope of work will cover other system disturbances like Loss of Generation, Fault , Large motor starting etc..
- Corrective action to restore the tie line power flow to its original value has to be performed by the Electrical Control System (ECS) provided at Refinery and Fertilizer plant.
TABLE 1
Case 1:15 MW Load Switch ON at Fertilizer Plant (Governor Droop setting – Setting 1)
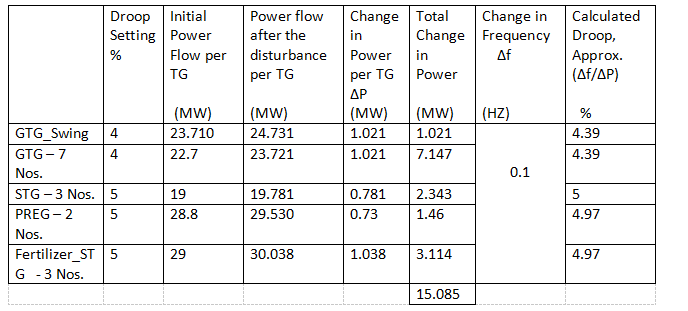
NOTE 1 : Net Power Flow from Refinery to Fertilizer plant is 12 MW Approx.
TABLE 2
Case 2:15 MW Load Switch ON at Fertilizer Plant (Governor Droop setting – Case 2)
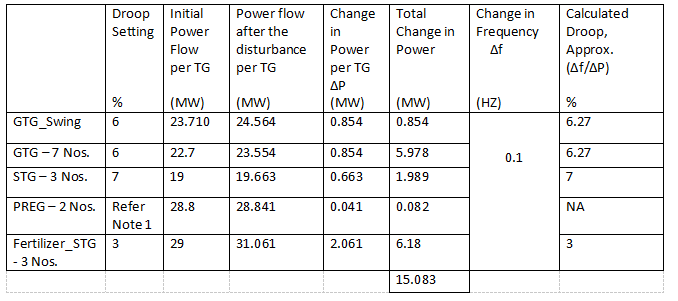
NOTE 1: PREG is in Constant Power Mode.
NOTE 2 : Net Power Flow from Refinery to Fertilizer plant is 9 MW Approx.

No comment